Architecture Overview
This page describes the architecture of the Carbonaut project. This document is intended to convey the essence of the architecture, with further details available on separate concept sub-pages. The diagram below shows the general overview of the Carbonaut project, by describing each individual components in the following sections.
Context
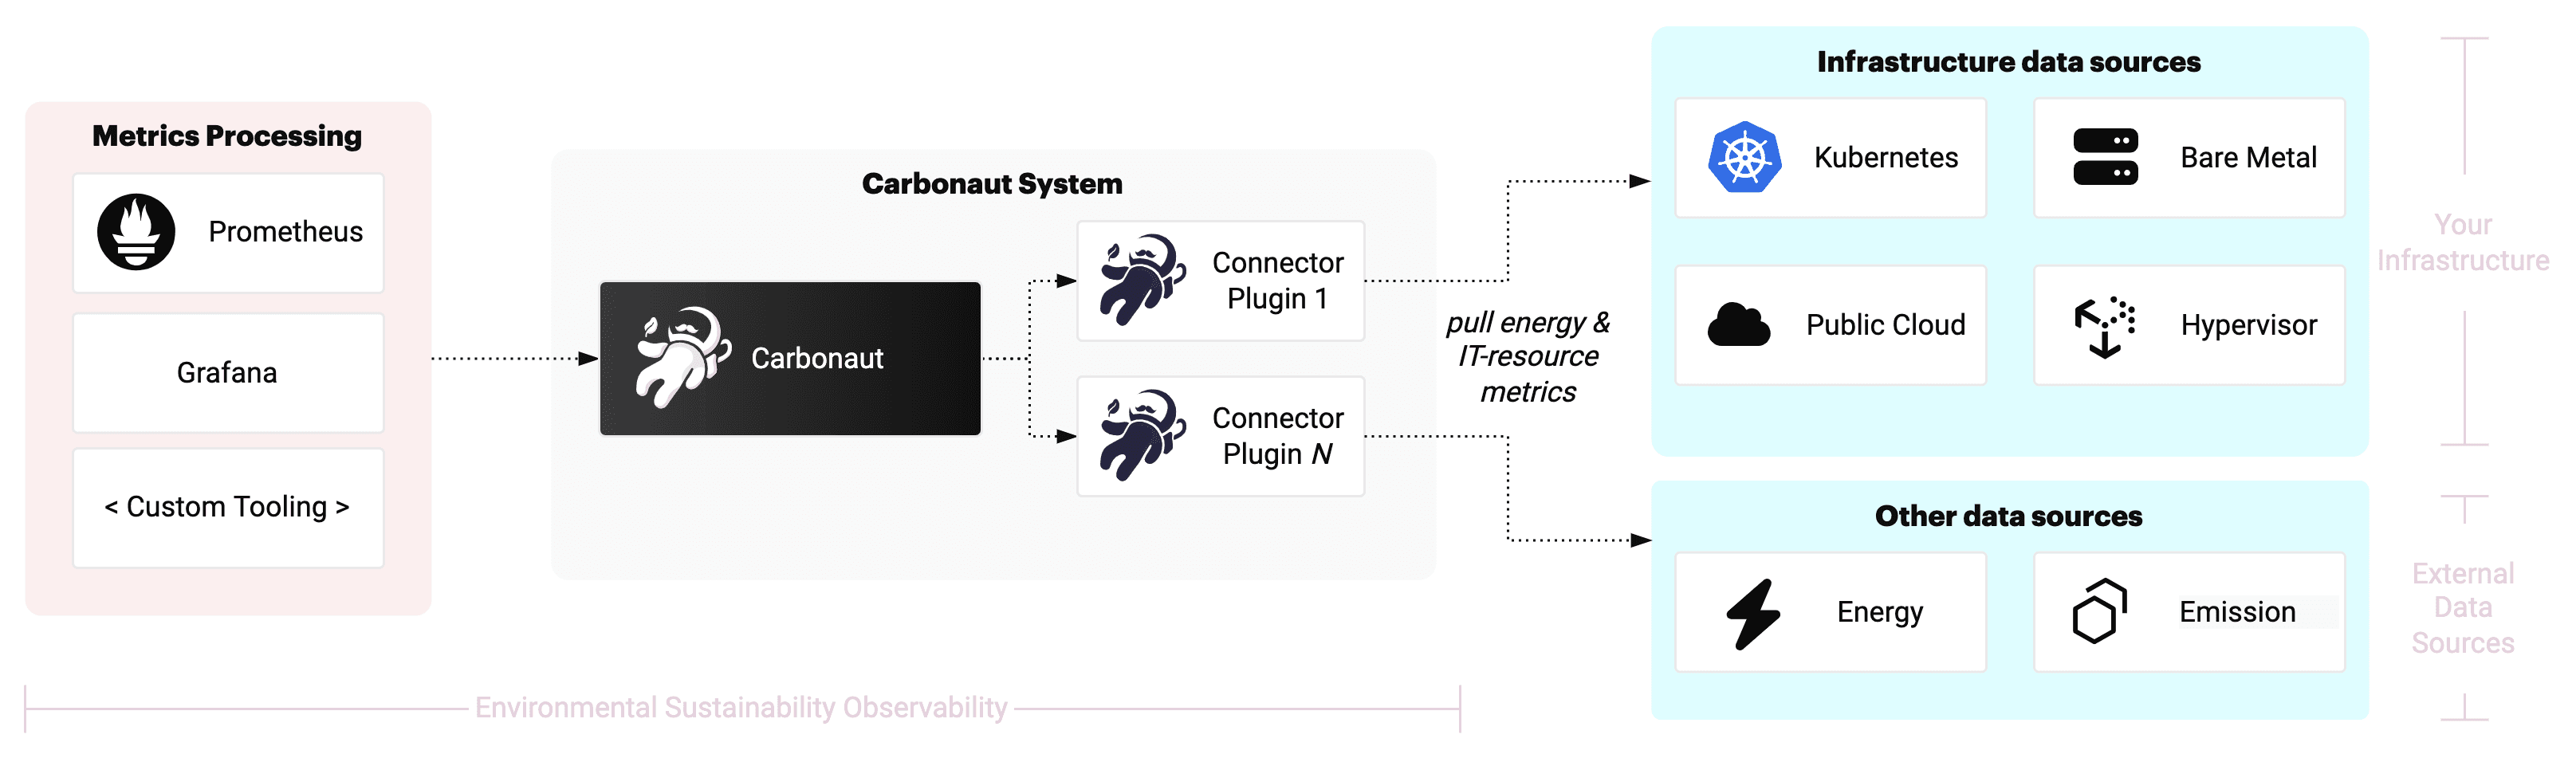
The Carbonaut project aims to establish a data layer for environmental sustainability related software data so that it can be used by a variety of applications. More information about the vision and goals are found here →. The diagram below shows the general context of Carbonaut.
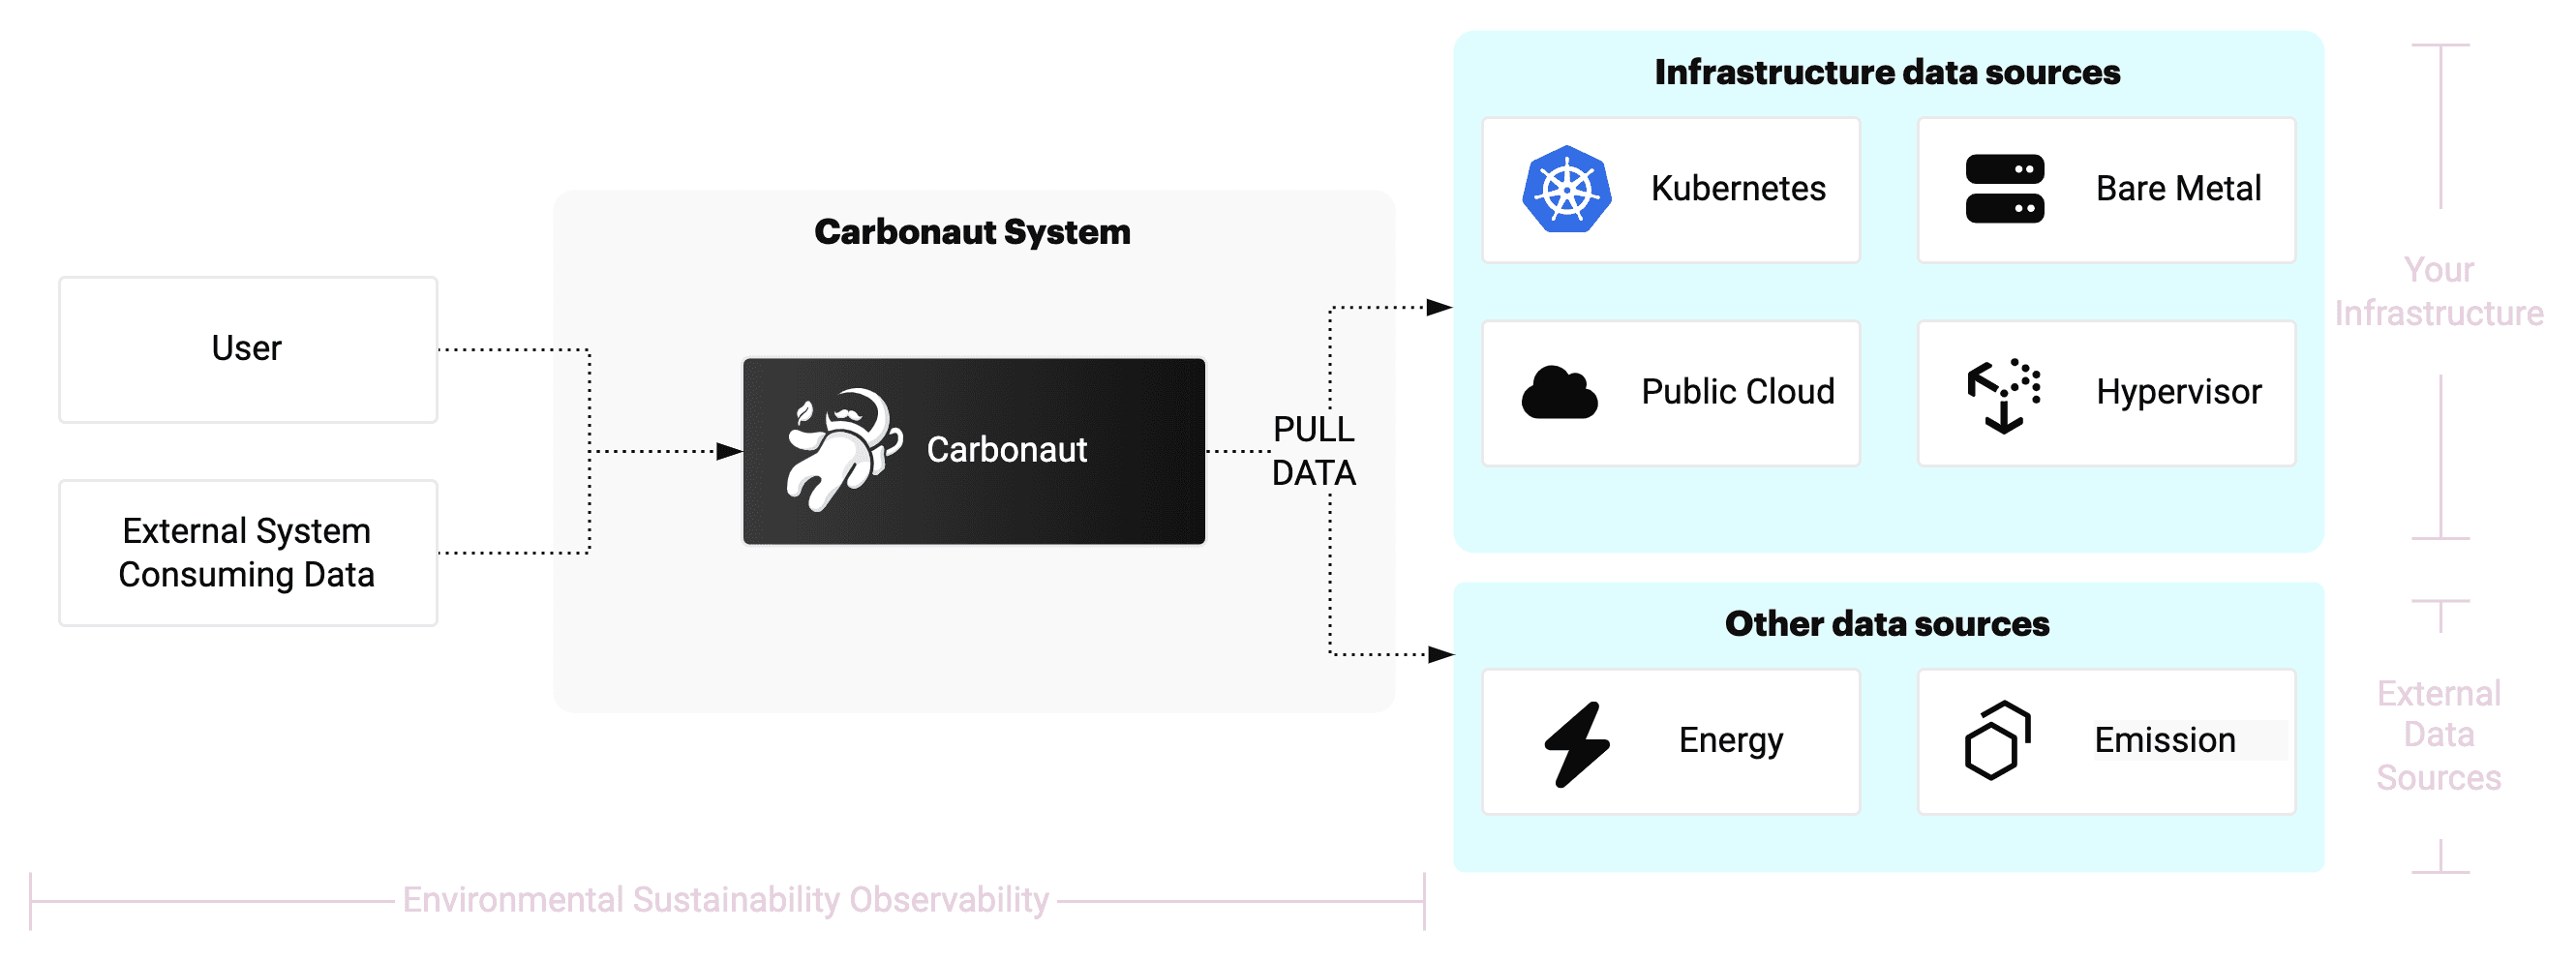
To set up a data layer, Carbonaut needs to collect data from various sources and integrate it into a common schema that can be used by applications. To know how your IT infrastructure is designed, you need to know about your deployments in Kubernetes or in cloud. To calculate the carbon footprint of your applications, you also need to know about the energy consumption of the data centers you use. All of this needs to be integrated, and since the data comes from multiple sources, it needs to be normalized. Especially for large companies with many different applications, this is a complex task.
Big Data Setting
In general, the project is placed in a big data system setting. As mentioned before, establish a software sustainability data layer, the project needs to work with loads of different kinds of heterogeneous data formats and needs to integrate the data into a common schema. If we follow a generic big data architecture, we have something like the diagram shown below.
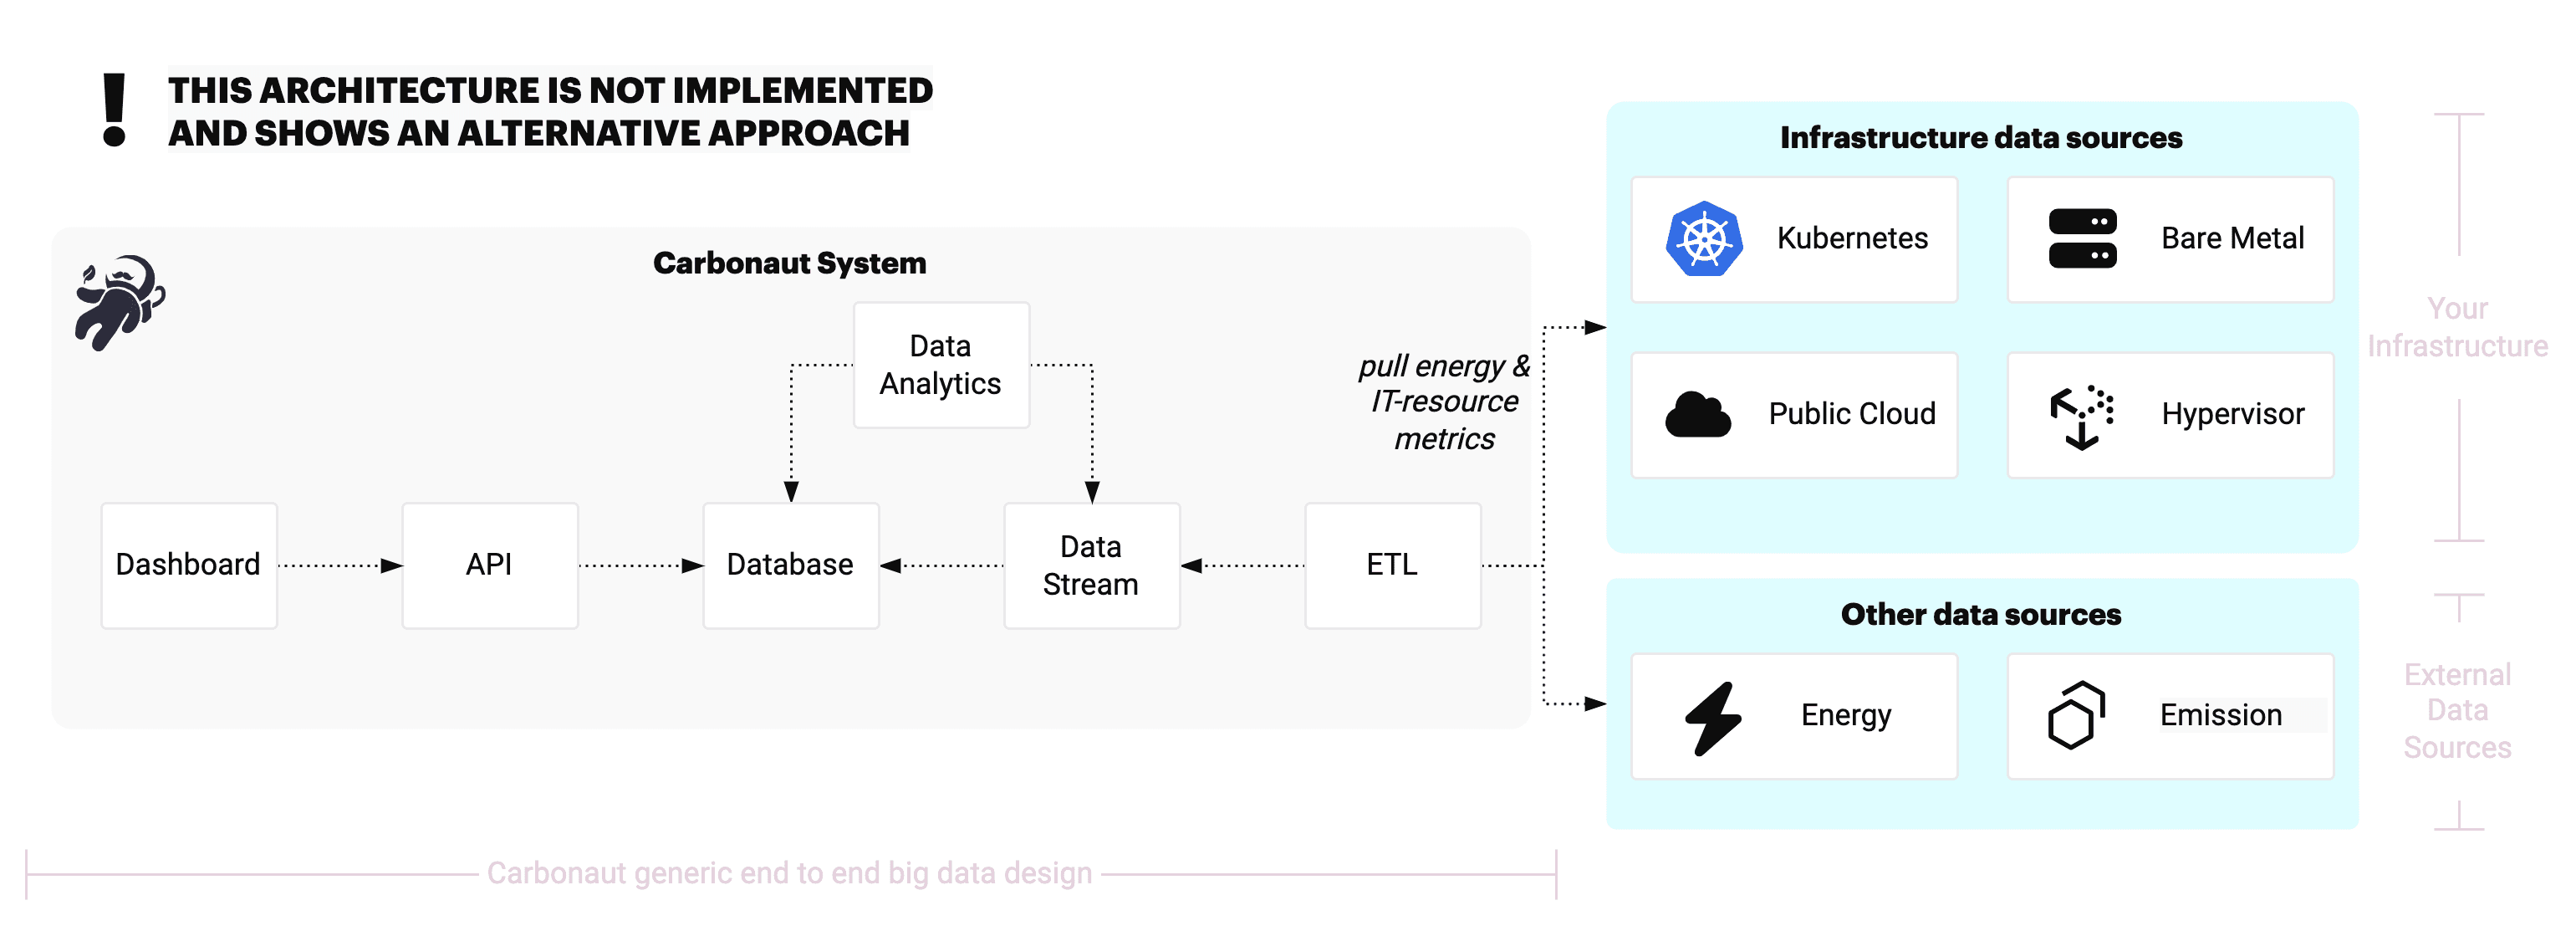
The ETL service is responsible for performing the data integration of the different kinds of data sources. The ETL sends the data through a data stream (e.g., Apache Spark) and into a database. Another service does analytics on the stored data, for example in real time through the data stream or via batching on top of the database. An API provides a nice interface of the collected data to display it in a user interface. Carbonaut could follow this pattern and build an entire end to end suite.
However, usually, there is no need to build an entire system and the Carbonaut idea can be embedded in existing systems. The Cloud Native community build powerful standards and tools with Prometheus (opens in a new tab) and Open Telemetry (opens in a new tab), which can be extended. The Carbonaut project therefore proposes single building blocks which can be integrated in your big data system without dictating the entire end to end big data system. The diagram below illustrates this idea.
Reflecting on the big data architecture diagram further, the main core components, which are Carbonaut specific, are the ETL service and to some extent the analytics service. All the other components can be defined by the end user and are not core to the Carbonaut project. The Carbonaut project implements this ETL service, which also performs lightweight static analysis.
Carbonaut Building Blocks
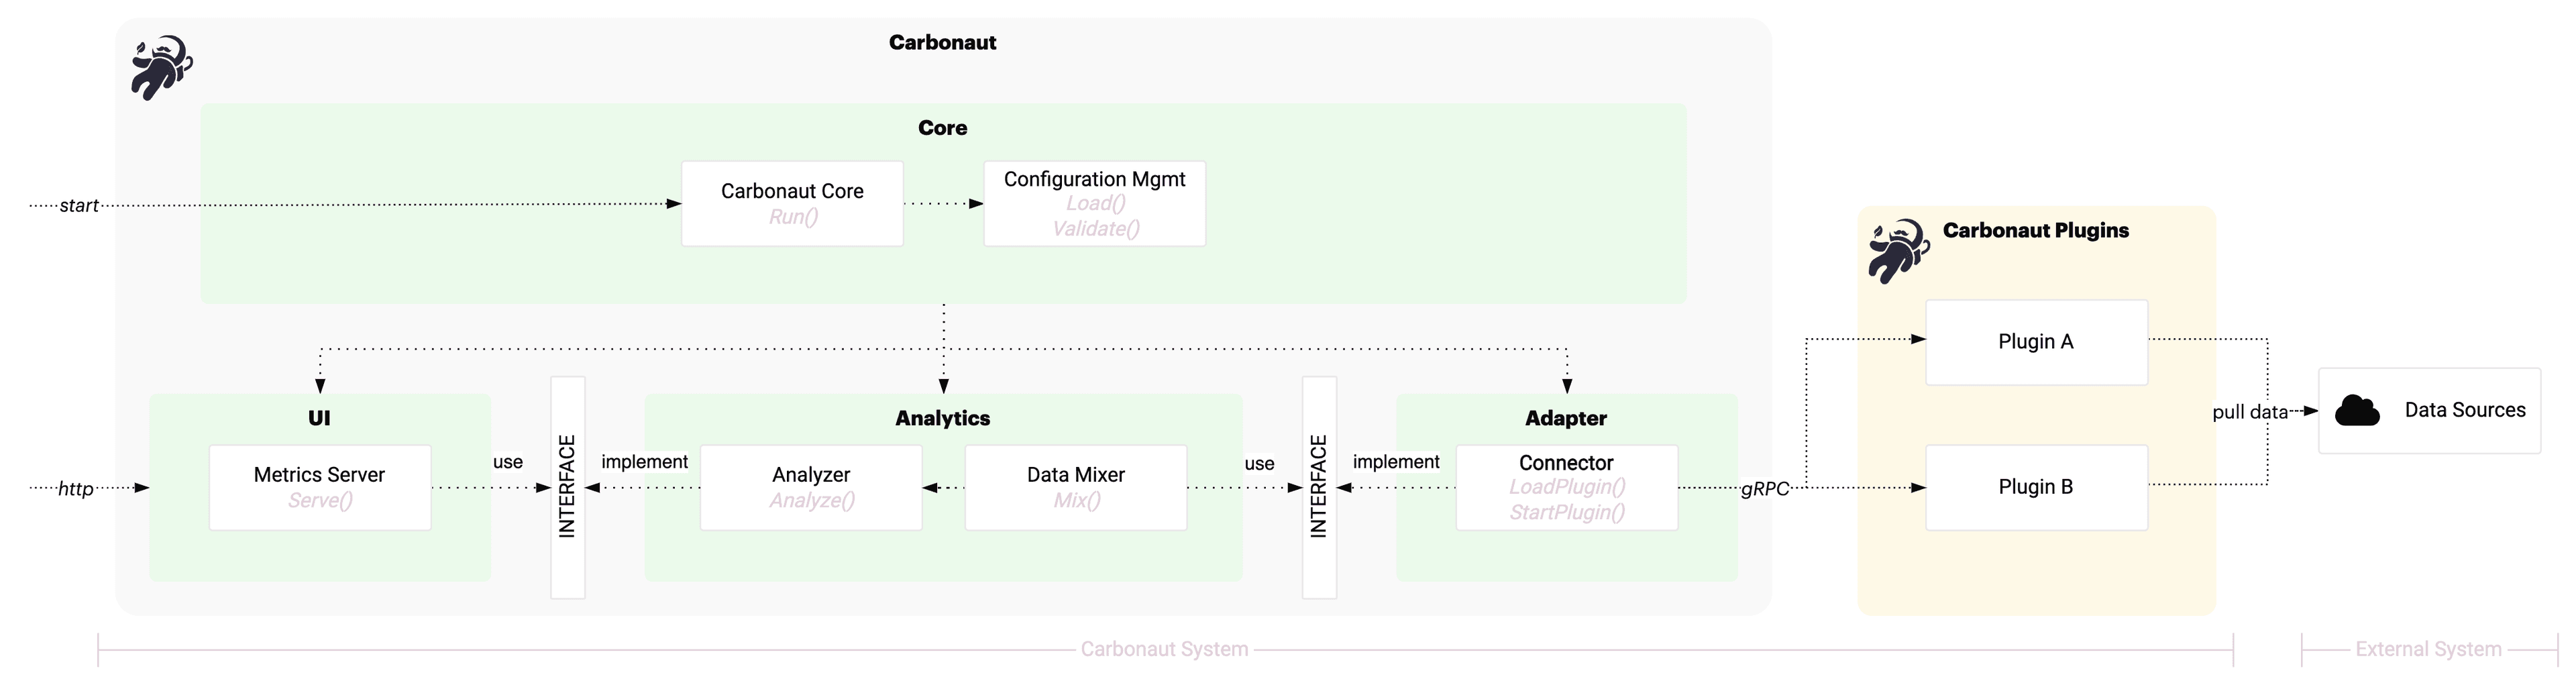
The technical components of Carbonaut are shown below.
Components:
- Core: The core puts all the other components together. It is responsible for the lifecycle management.
- Configuration Management: Carbonaut uses
yamlfiles for its configuration. Updating the configuration results in a restart of Carbonaut. - Connector: The connector is responsible for loading and managing plugins. Plugins can be deployed as subprocess inside the Carbonaut container or managed independently as a seperate process. Regardless of the deployment, plugins implement a gRPC (opens in a new tab) server which is used to communicate with the plugin adapter.
- Data Mixer: The data mixer joins by configuration data sources from different metrics together to create higher quality metrics (for example, emissions for your Kubernetes nodes based on the energy consumption and location of the underlying data center). The data mixer should allow to swap out data models and caluclations at runtime without altering the origin of the data.
- Analyzer: The analyzer is responsible for performing static analysis on the data. The analyzer is also responsible for creating meta-metrics about the data collection.
- Metrics Server: The metrics server exposes the metrics in the Open Telemetry format.
Plugin A and Plugin B are two different plugins shown to illustrate the Connector component. The Connector integrates with any number of plugins that implement the gRPC client.
Data flow
Carbonaut data integration is split into three sections, which are executed after one another.
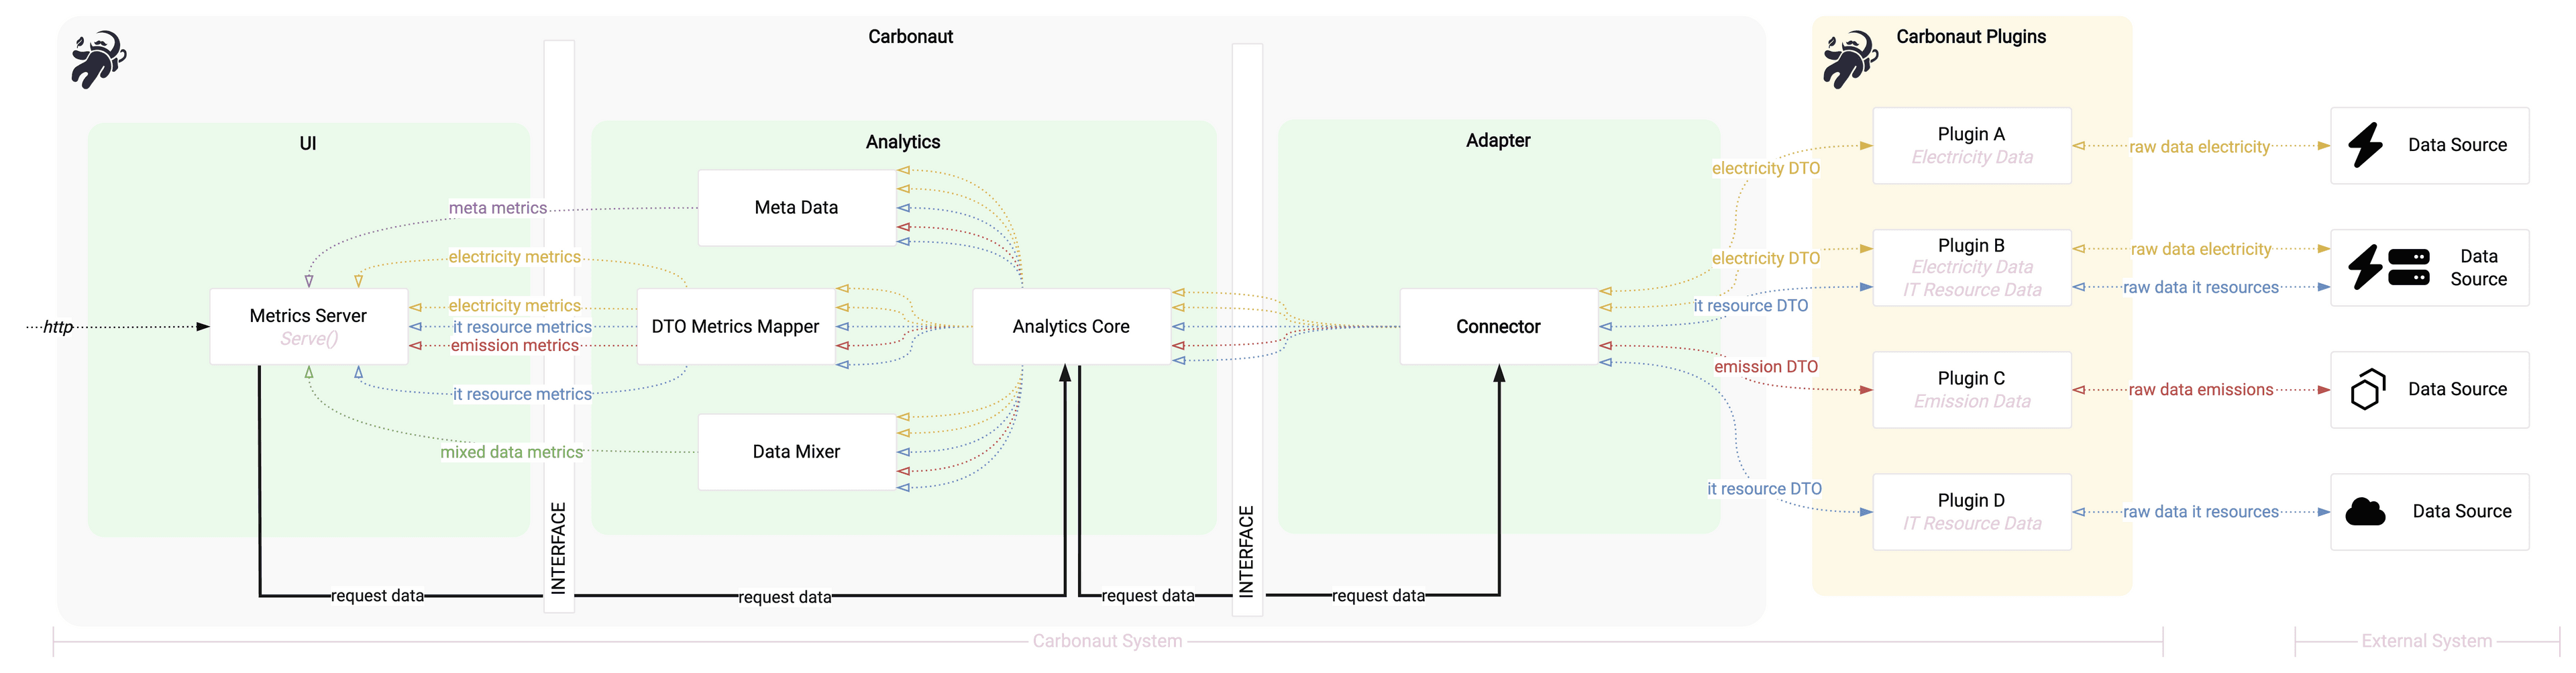
- First, the plugins gather raw data from the data sources. This data is vendor-specific and can be in any format. The plugins are responsible for normalizing the data into a common format. The common format is the Carbonaut DTO schemas (DTO stands for Data Transfer Object).
- The connector receives the normalized data from the plugins and sends it to the analytics component, which includes the data mixer subcomponent, the meta metrics subcomponent and the DTO transformer subcomponent.
- The data mixer joins the data from different plugins together and creates
MixedMetrics. - The meta metrics subcomponent creates meta metrics about the data collection.
- The DTO transformer subcomponent transforms the data DTO schemas into Carbonaut metrics without performing further data manipulation.
- The data mixer joins the data from different plugins together and creates
- The metrics server requests the metrics data schemas from the analytics component and exposes them in the Open Telemetry format.
The following diagram shows the data flow with four plugins connected as an example.
The page Carbonaut Data Schema describes the data schemas in more detail and the page Carbonaut Data Mixer describes how the data mixer enriches different data sources.
Deployment
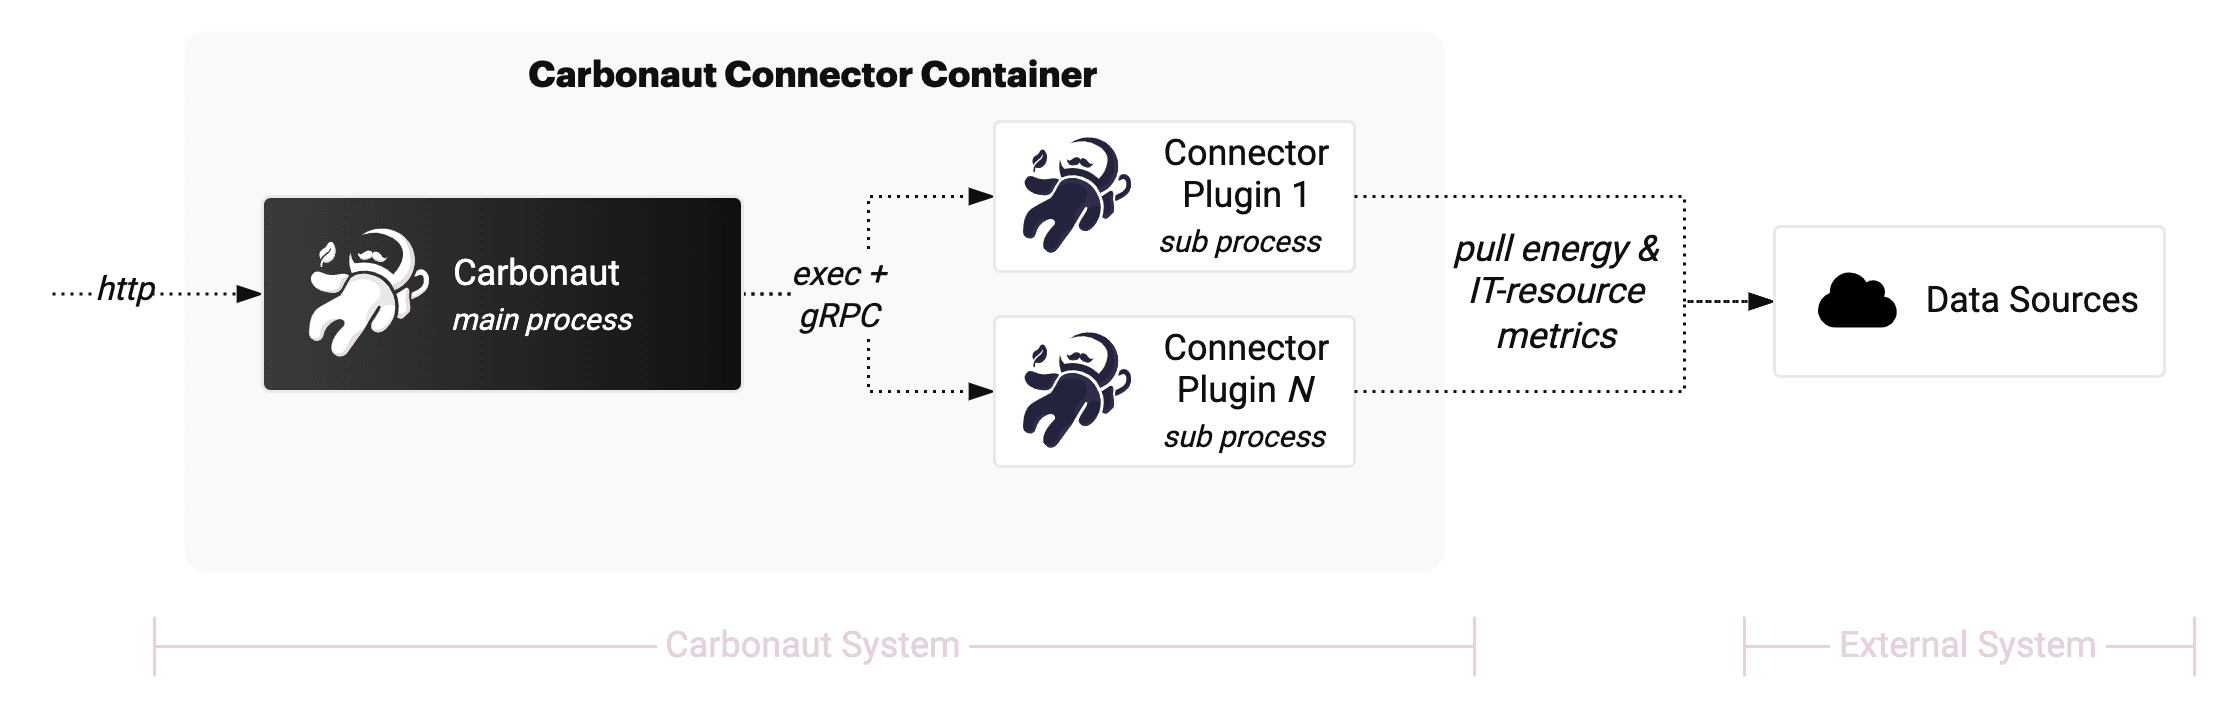
Carbonaut can be deployed in two flavours, single deployment mode (e.g. one container) or multi deployment mode (e.g. multiple containers). The fist diagram shows the single container mode where plugings are started as subprocesses and integrated via gRPC. The second diagram shows the multi container mode where plugins are run as seperate instances (for example as containers) which are also integrated via gRPC.
Single Deployment Mode ref deployment guide →
Multi Deployment Mode ref deployment guide →
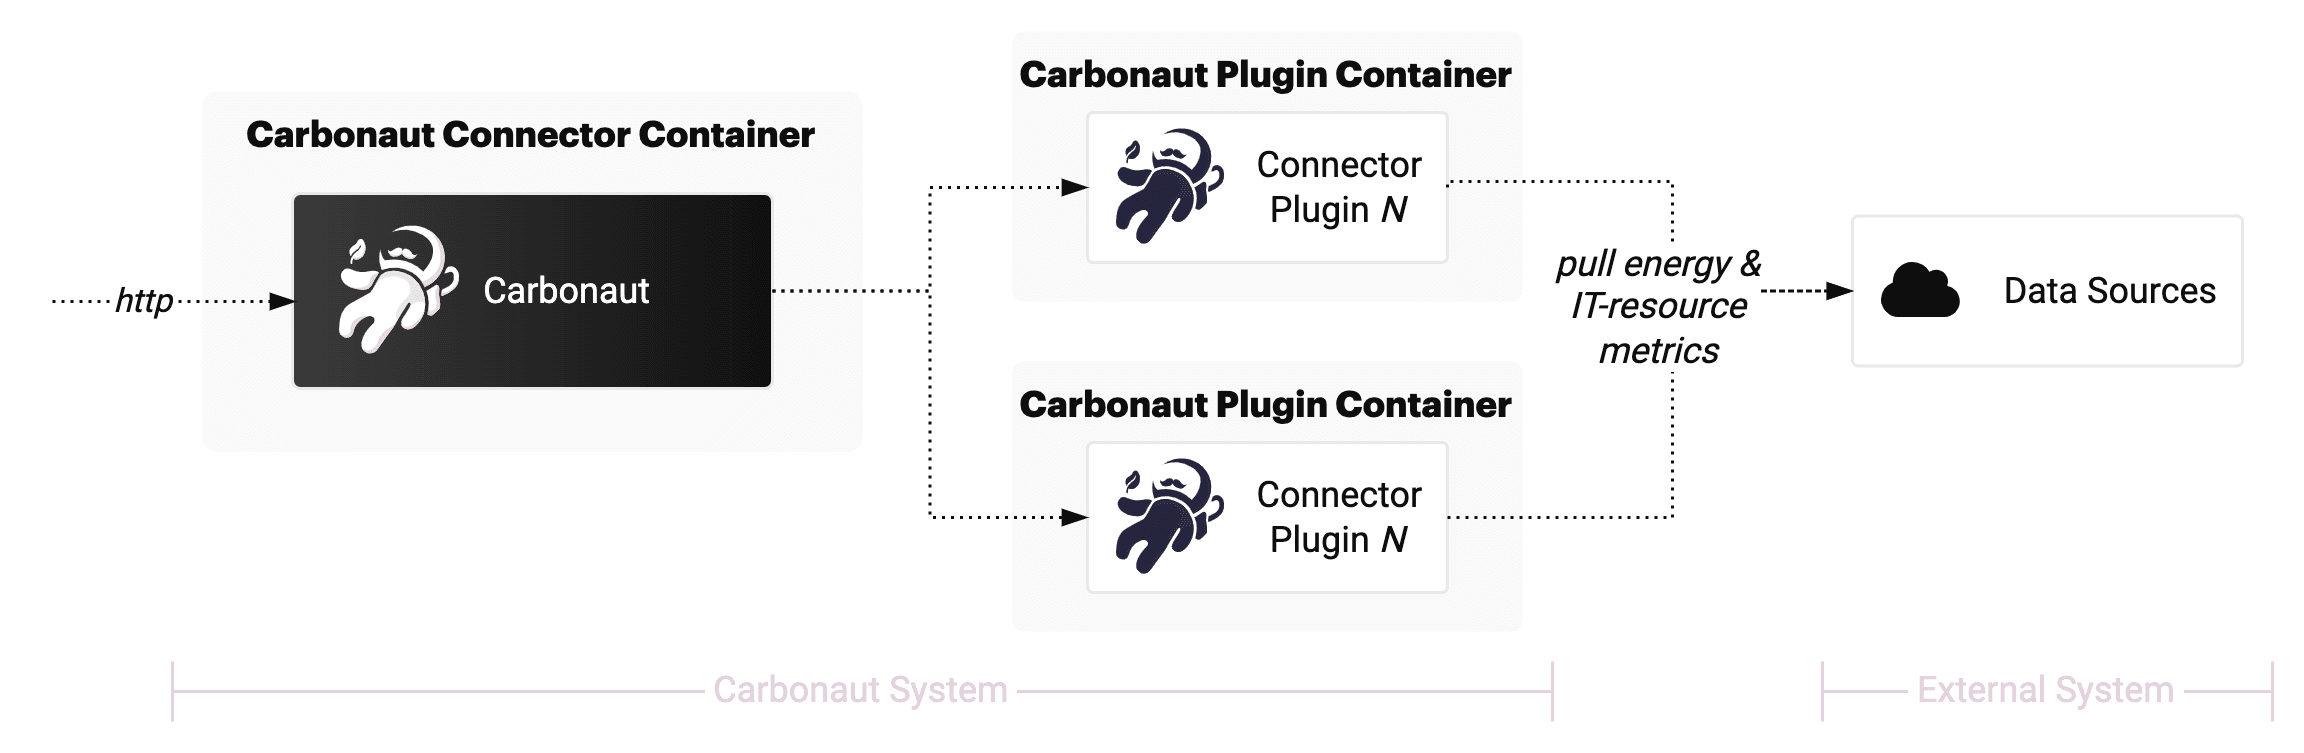
For some big systems a single Carbonaut depolyment will be the bottleneck. In this case it is possible to run multiple Carbonaut instances in parallel with a distinct plugin configuration.
Carbonaut the Cloud Native Application
The Carbonaut project follows the cloud native application design principles, scalability, loose coupling, resilience, manageability and observability.
| Design principle | Explanation | Realization |
|---|---|---|
| Scalability | The ability of a system to behave as expected in the face of significant upward or downward changes in demand without the need to be refactored to perform its intended function. | Enable multi Carbonaut deployment (for example Carbonaut deployment by region) |
| Loose Coupling | Components have minimal knowledge about other components. Changes to one component also do not require changes to another component (components are loosely coupled). | Integrating data sources via plugins, using gRPC |
| Resilience | Measure how well a component withstands and recovers from errors and faults. Operation should be possible at a reduced level without failing completely. | Stateless design, independent plugins |
| Manageability | The ability to change the behavior of a component without altering the code. | enabling the use of third party plugins, generic Carbonaut data schema, exposing a common metrics format |
| Observability | Measure of how well and accessible a component makes information about its internal state available without the need of altering the code. | Exposing additional meta metrics about the metrics gathering process |